| |
|||


| tutorial | |||
integrated chart engineCharts are a common and important way to display
data in business intelligence and other applications.
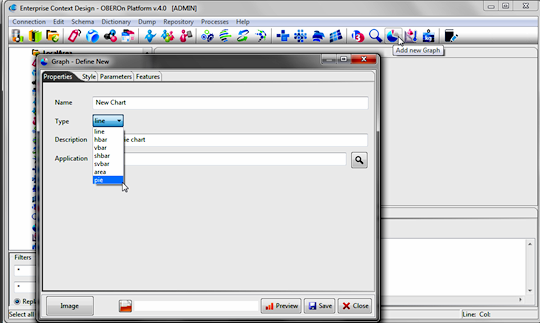
Available graph Types are:
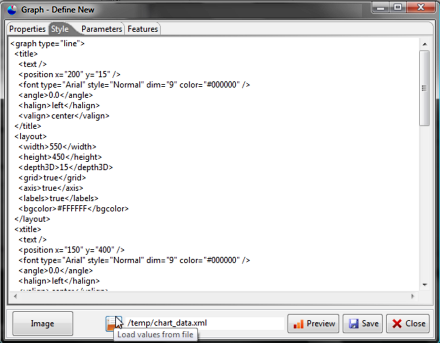
You can change directly the graph-Style by editing the xml code, but it is more convenient to set the properties in the "Parameters" panels (any change in the XML is reported to the "Parameters" panels and any change inside the panels updates the XML style).
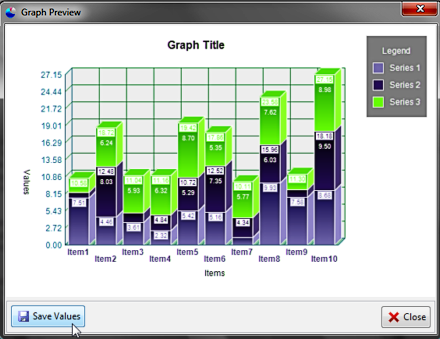
Random values can also be saved and used
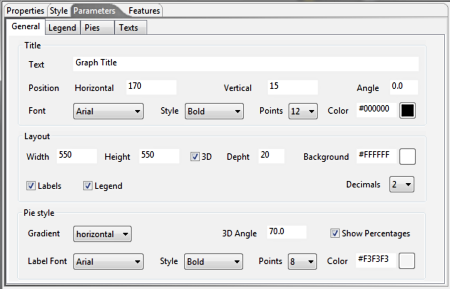
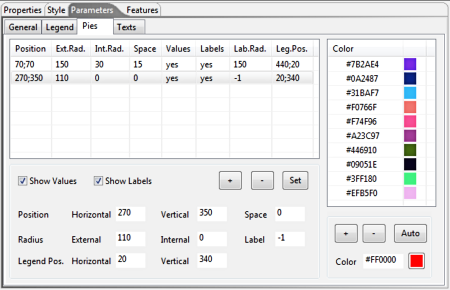
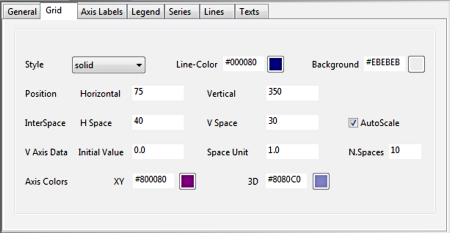
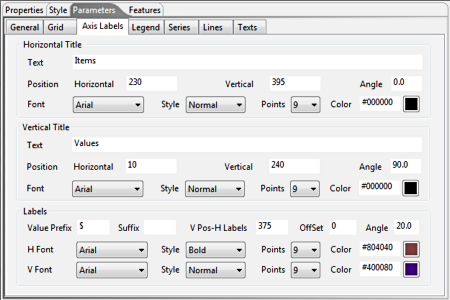
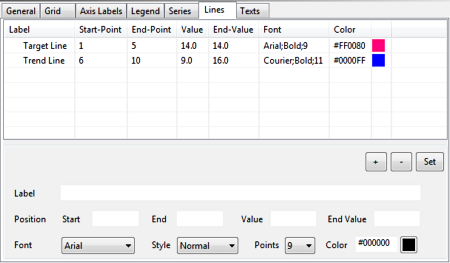
for the next previews. Multiple Pie Chart 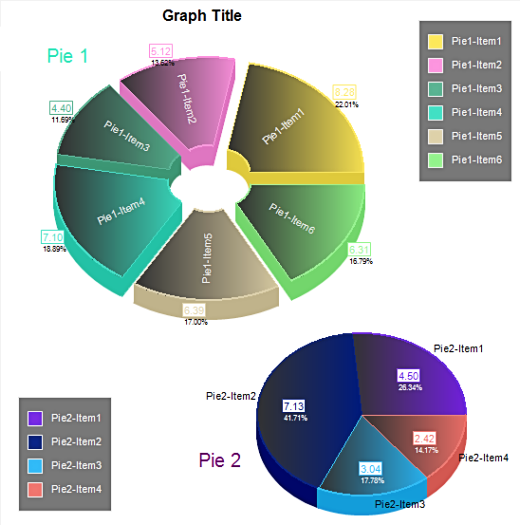 Features: - Configurable canvas size and color - Multiple plots (configurable pie position, external radius and internal hole radius) - Automatic spice color generator - Title/Label font, position,orientation and color selectable - Labels, values and percentages on/off switch - Horizontal and vertical gradient spice effect - Configurable depth of the 3D effect (2D style also available) - Configurable number of decimal places to show values - Automatic multiple legend generation with custom text font, position, background and border colors - Free texts can be placed into the chart canvas Line Chart 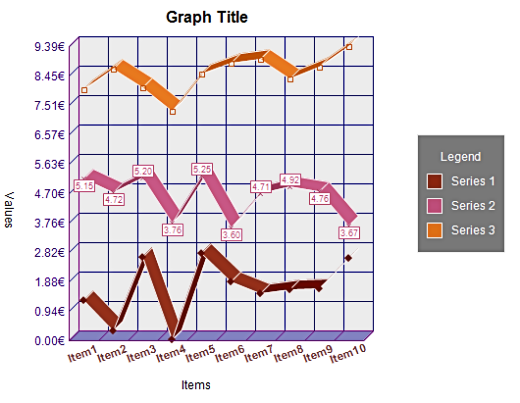 Features: - Configurable canvas size and color - Multiple series plots (configurable line style, color, width, point symbol and dimension) - Grid autoscale - Graph title /Axis title/Labels - font style, position,orientation and color selectable - Labels, values , axis and grid on/off switch - Custom value prefix and suffix - Configurable depth of the 3D effect (2D style also available) - Configurable number of decimal places to show values - Automatic legend generation with custom text font, position, background and border colors - Free texts can be placed into the chart canvas - Target / Trend lines can be placed over the chart grid Area Chart 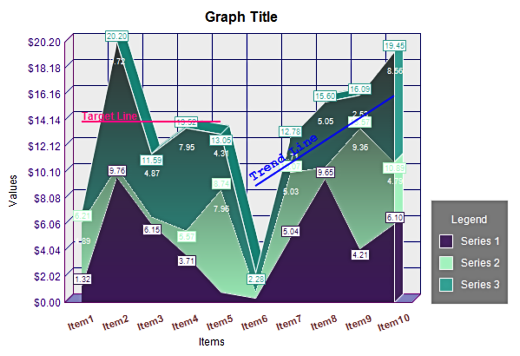
Features: - Configurable canvas size and color - Multiple series plots (configurable area color, point symbol and dimension) - Grid autoscale - Graph title /Axis title/Labels - font style, position,orientation and color selectable - Labels, values , axis and grid on/off switch - Custom value prefix and suffix - Horizontal and vertical gradient area effect - Configurable depth of the 3D effect (2D style also available) - Configurable number of decimal places to show values - Automatic legend generation with custom text font, position, background and border colors - Free texts can be placed into the chart canvas - Target / Trend lines can be placed over the chart grid Column (Vertical Bar) Chart 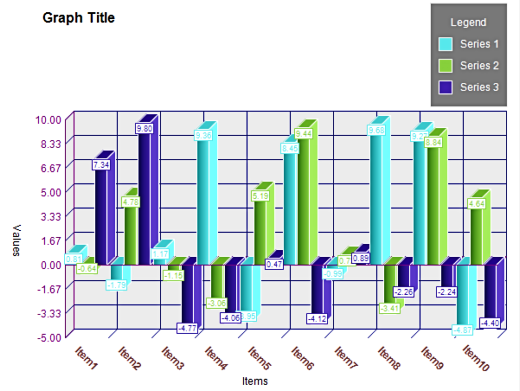 Features: - Configurable canvas size and color - Multiple series plots (configurable bar color, width, border and interspace) - Grid autoscale - Graph title /Axis title/Labels - font style, position,orientation and color selectable - Labels, values , axis and grid on/off switch - Custom value prefix and suffix - Horizontal and vertical gradient bar effect - Configurable depth of the 3D effect (2D style also available) - Configurable number of decimal places to show values - Automatic legend generation with custom text font, position, background and border colors - Free texts can be placed into the chart canvas - Target / Trend lines can be placed over the chart grid Stacked Column (Vertical Bar) Chart 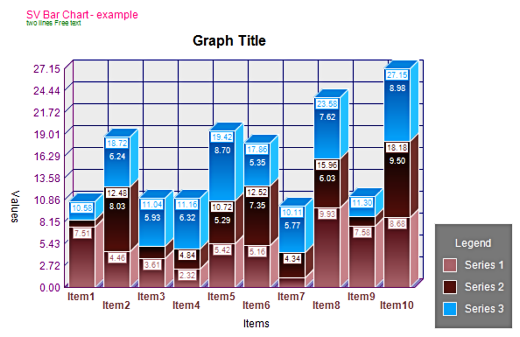 Features: - Configurable canvas size and color - Multiple series plots (configurable bar color, width, border and interspace) - Grid autoscale - Graph title /Axis title/Labels - font style, position,orientation and color selectable - Labels, values , axis and grid on/off switch - Custom value prefix and suffix - Horizontal and vertical gradient bar effect - Configurable depth of the 3D effect (2D style also available) - Configurable number of decimal places to show values - Automatic legend generation with custom text font, position, background and border colors - Free texts can be placed into the chart canvas - Target / Trend lines can be placed over the chart grid Horizontal Bar Chart 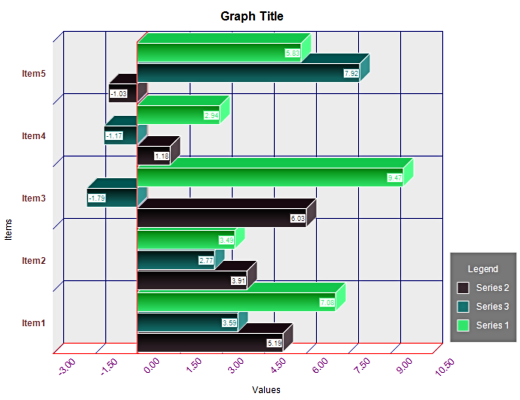
Features: - Configurable canvas size and color - Multiple series plots (configurable bar color, width, border and interspace) - Grid autoscale - Graph title /Axis title/Labels - font style, position,orientation and color selectable - Labels, values , axis and grid on/off switch - Custom value prefix and suffix - Horizontal and vertical gradient bar effect - Configurable depth of the 3D effect (2D style also available) - Configurable number of decimal places to show values - Automatic legend generation with custom text font, position, background and border colors - Free texts can be placed into the chart canvas - Target / Trend lines can be placed over the chart grid Stacked Horizontal Bar Chart 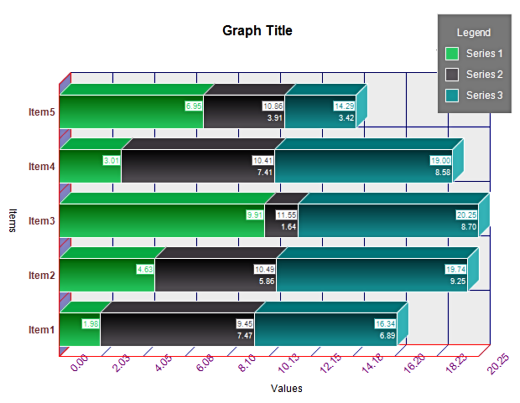
Features: - Configurable canvas size and color - Multiple series plots (configurable bar color, width, border and interspace) - Grid autoscale - Graph title /Axis title/Labels - font style, position,orientation and color selectable - Labels, values , axis and grid on/off switch - Custom value prefix and suffix - Horizontal and vertical gradient bar effect - Configurable depth of the 3D effect (2D style also available) - Configurable number of decimal places to show values - Automatic legend generation with custom text font, position, background and border colors - Free texts can be placed into the chart canvas - Target / Trend lines can be placed over the chart grid
|
Please Read: Privacy Policy and Terms of Use