| |
|||


| tutorial | |||
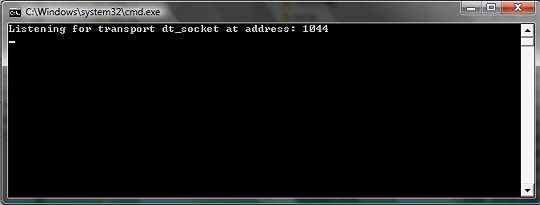
debug program and trigger source code [since 2.0]Trigger, webservice and program source code is stored inside the OBEROn database and it is compiled "on the fly" the first time it is executed. Even if these programs are usually simple [used only to customize OBEROn functionalities], maybe you need to debug the java code. Some tools like the Eclipse IDE allows to perform the remote debugging; let see how we can do it with OBEROn programs inside the Enterprise Context Design administration client: 1. Active the debug option into the cofiguration file Open the configuration file "oberon.ini" and set the option "debug=true" ; when this parameter is enabled OBEROn extracts the source code from the DB without the timestamp in the java class name and it adds debug information when it compile the java source code. 2. Set debug argument for Java Remote Debugger The Java Debugger (jdb) is a dynamic, controlled, assignment-based debugging tool. It helps find and fix bugs in the Java language programs both locally and on the server. To use jdb in a J2EE application server you must first launch it with debugging enabled and attach to the server from the debugger through a JPDA port (Default port is 1044). The default JPDA options for J2EE servers are as follows: -Xdebug -Xrunjdwp:transport=dt_socket,server=y,suspend=n,address=1044 The jdb parameters specify the way debugger will operate. For instance transport=dt_socket instructs the JVM that the debugger connections will be made through a socket while the address=1044 parameter informs it that the port number will be 1044. Similarly, if you substitute suspend=y , the JVM starts in suspended mode and stays suspended until a debugger is attached to it. This may be helpful if you want to start debugging as soon as the JVM starts. To active the remote debug remove the comment in the config.bat (config.sh) file: SET/export DEBUGARG=-agentlib:jdwp=transport=dt_socket,server=y,address=1044
3. Launch the administration client JVM After activated the remote debugging argument if you start the Context Design console (startdesign) or the Object Manipulation (startobjects) the JVM stays suspended until the debugger is attached to it.
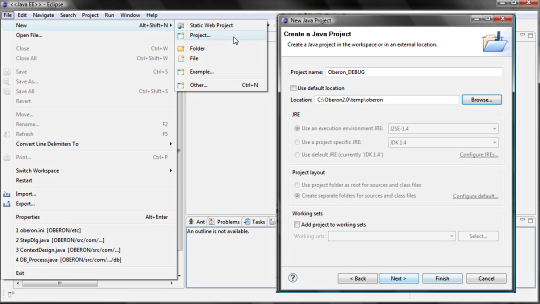
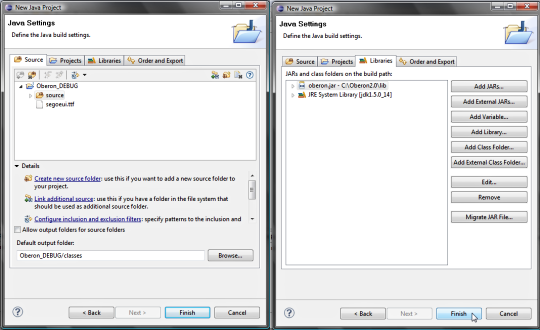
4. DEBUG WITH ECLIPSE By the Eclipse wizard create a new Java Project using the location <TEMPDIR>/oberon. The <TEMPDIR> folder is also defined into the config.bat (config.sh) file.
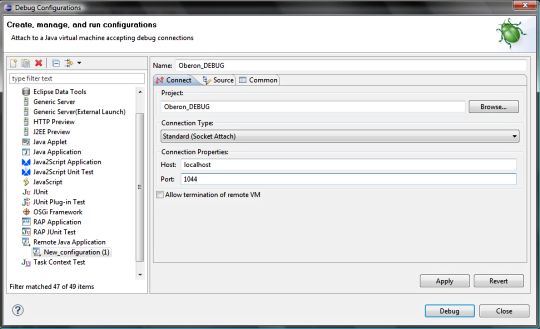
4.2 Create new Remote Java Application configuration in Eclipse In Eclipse, navigate to Run | Debug Configuration... and select Remote Java Application , on the left column. Click New , on the bottom of the same column.
In the Create configuration screen you'll be
prompted to enter some values. Start with a name. For Project, select
the Java project just created. Leave Connection Type in default,
i.e. Standard (Socket Attach) . For Host , enter localhost. If you
want to debug a remote server, enter its hostname or IP address.
For port, enter 1044 or the port you defined in your config script.
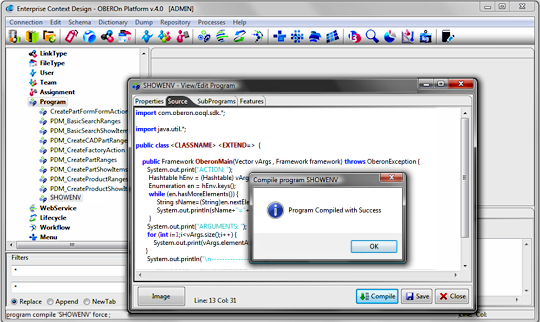
5. Compile the program to debug and open the source code into the debugger The program source code is exported into the <TEMPDIR>/oberon/source
folder for the compilation and the compiled classes are stored
into the <TEMPDIR>/oberon/classes. This happens when
the program is executed or when you force the compilation with the
administration client.
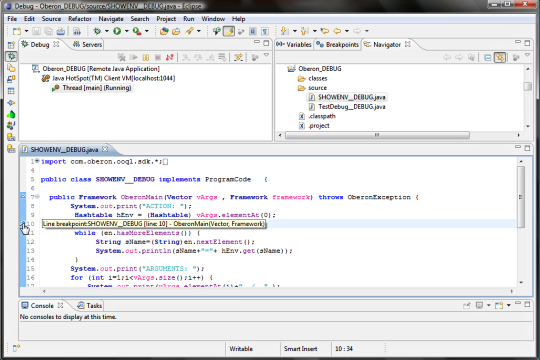
Select the exported java file from the source
folder and open it into the debugger; apply breakpoints for the
parts to debug.
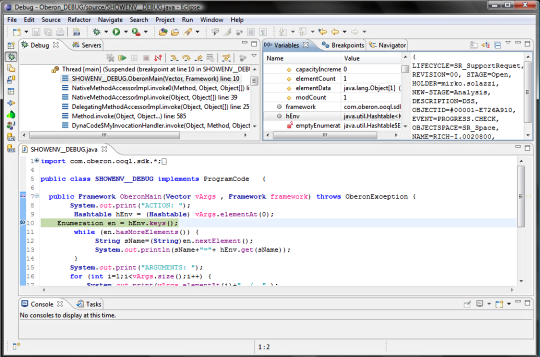
6. Execute the program or generate the event You are now ready for debug the code; just execute the program inside your application client or make action that generate the event managed with the trigger.
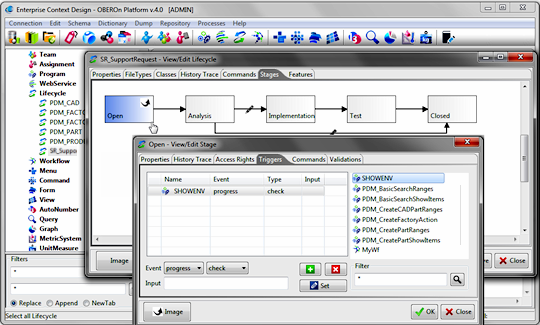
For example, imagine you have a trigger for the progress.check event on the Open stage in the SupportRequest lifecycle (see above image). If you try to promote an object with this lifecycle in the Open stage the debugger should take the control and you can see the JVM status for the set breakpoints. (Seach for a object in this condition) query immediate object * *
* filter ( lifecycle == "SR_SupportRequest" && object progress #00001-E726A910;
|
Please Read: Privacy Policy and Terms of Use